abhinav314.github.io
Portfolio Optimization & Predicting Stock Price
Business Objective
The main objective in today’s financial landscape is very simple – to maximize returns while lowering risk. At first, this sounds straightforward, however it is this balance which people are striving to achieve. Portfolio construction and selection is an investment strategy that allows investors to optimize the overall rate of returns for the risk. Hence a solution which works to resolve these challenges is of utmost importance and greatly valued in financial management. This forms our core outline for picking this topic.
Data Manipulation
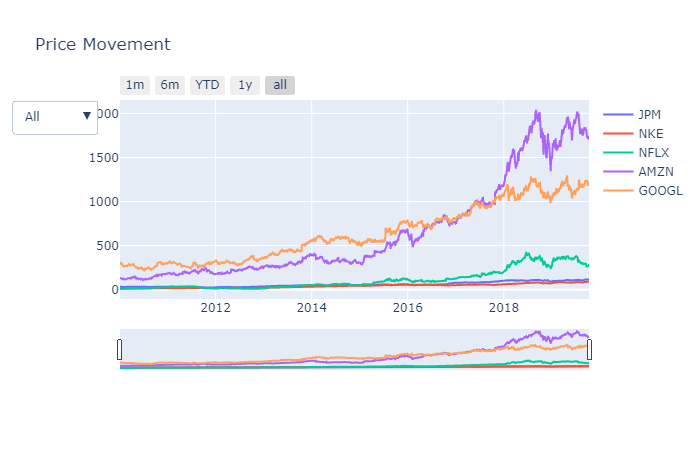
As part of the project we tried to solve the business problem highlighted above with the application of modern analytical tools and computational processes. Firstly, we retrieved the data of multiple securities for various companies like Apple, Google and Netflix etc. through web scrapers. The data for the previous 10 years was picked up from Yahoo Finance and then processed by our application. Secondly, we built an UI on Python to allow users to select as many organizations as they want to. The idea behind building up an analytical solution was to randomize the generation of portfolio’s comprising of securities from various companies to best fit constraints (maximize return, minimize risk, optimum Sharpe ratio) specified by an investor.

Portfolio Optimization
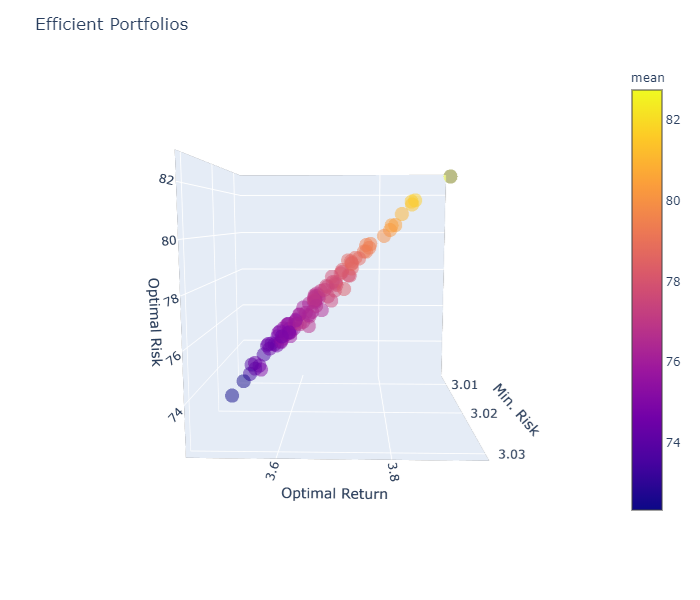
We implemented sophisticated computational tools such as parallel processing to generate the aforementioned randomized portfolio combinations. Our algorithm crunched through a million combinations to generate the “efficient frontier” based on the user’s criterion.

Maximum Sharpe Ratio Portfolio Allocation
Annualised Return: 82.75
Annualised Volatility: 3.46
| JPM | NKE | NFLX | AMZN | GOOGL |
|---|---|---|---|---|
| 0.63 | 40.23 | 26.48 | 29.57 | 3.09 |
Minimum Volatility Portfolio Allocation
Annualised Return: 54.48
Annualised Volatility: 3.01
| JPM | NKE | NFLX | AMZN | GOOGL |
|---|---|---|---|---|
| 2419 | 38.82 | 2.88 | 0.63 | 33.48 |
Portfolio Return Predictions
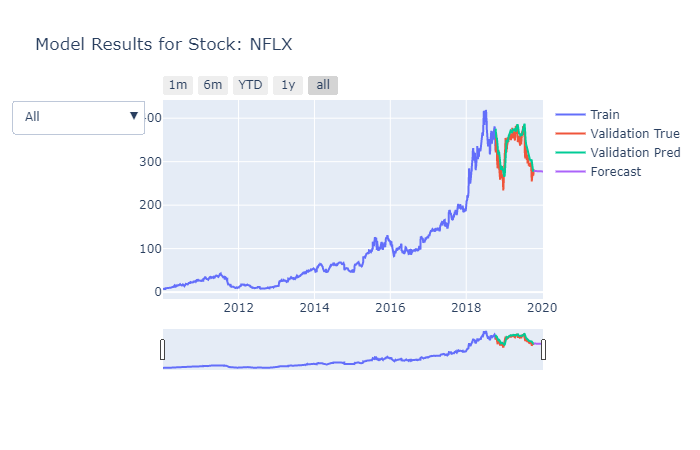
Finally, we selected the top 50 portfolio combinations, and applied a TensorFlow based Long Short Term Memory (LSTM) model to predict quarterly returns. The application would then go on and predict stock price from the optimal solution over a period of time to give the investor a complete picture of the return on investment done.

PORTFOLIO FOR MAXIMUM SHARPE RATIO
List of Stocks: [‘JPM’, ‘NKE’, ‘NFLX’, ‘AMZN’, ‘GOOGL’]
Corresponding % Weight: [ 0.63 40.23 26.48 29.57 3.09]
ORIGINAL MONEY INVESTED: 100 $
FORECASTED PORTFOLIO VALUE: 82.27 $
GAIN IN VALUE AFTER 3 MONTHS: -17.73 $
PORTFOLIO FOR MINIMUM VOLATILITY
List of Stocks: [‘JPM’, ‘NKE’, ‘NFLX’, ‘AMZN’, ‘GOOGL’]
Corresponding % Weight: [24.19 38.82 2.88 0.63 33.48]
ORIGINAL MONEY INVESTED: 100 $
FORECASTED PORTFOLIO VALUE: 84.47 $
GAIN IN VALUE AFTER 3 MONTHS: -15.53 $